Water/wastewater
Measurement of greenhouse gases (CH4, N2O, CO2) in municipal wastewater treatment plants
May 31 2024
Author: Dr. Wenzel Gruber, Prof. Dr. Gerhard Wiegleb and Malina Piasny on behalf of WITec GmbH
Free to read
Articles are free to download. Unlock the article to be shown more content, graphs and images.
Introduction
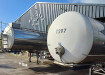
Wastewater treatment plants can emit relevant amounts of greenhouse gases. Process emissions of methane (CH4) and nitrous oxide (N2O) are often the most important greenhouse gas sources in wastewater treatment plants. CH4 is mainly produced and emitted through leakage in anaerobic process stages (anaerobic sludge treatment). Therefore, monitoring of methane emission requires monitoring approaches for diffuse emission sources, such as the tracer gas method or the drone flux measurement. N2O originates from biological nitrogen removal in the biological treatment and is largely released to the atmosphere during aeration of the sewage. Hence, methods to monitor emissions from point sources (flux hood method, e.g Figure 1) are optimal for quantification. Typically, a small share (0-2%) of the treated nitrogen is emitted as N2O. In a few cases, emission factors of up to 10% have been reported. Due to the high greenhouse gas potential of N2O (273 gCO2-e/gN2O for a 100-year timescale), small amounts of N2O have a substantial impact on the carbon footprint of wastewater treatment. In Switzerland, N2O from wastewater treatment plants cause roughly 1% of the countrywide greenhouse emissions.
Figure 1: off-gas collection and flow measurements on a full-scale wastewater treatment plant in Switzerland (upwater, 2023)
N2O is produced through multiple pathways in nitrification and denitrification. During mainstream wastewater treatment, N2O is primarily produced biotically (Figure 2) and to a minor extent abiotically. N2O formation is rather complex since multiple organisms are known to possess formation pathways. Ammonium oxidizing bacteria (AOB) are known to perform at least two pathways for N2O production. In heterotrophic denitrification, N2O is an obligate by-product but is fully degraded given that process conditions are set correctly. Heterotrophic denitrification is therefore an important and the only biological N2O sink in wastewater treatment. Other minimization strategies involve optimization of the aeration strategy in the biological treatment and an adapted nitrogen load management.
N2O emissions typically exhibit large diurnal and seasonal variations. Hence, long-term on-line monitoring approaches are required to properly estimate the N2O emission factor und test mitigation strategies. Off-gas monitoring systems are most suitable to measure the emissions given the low maintenance costs and the high spatial and temporal resolution. Additionally, monitoring of process emissions allows quantification of the oxygen transfer in biological treatment process enabling substantial process optimization and energy savings. However, off-gas monitoring is generally not established on wastewater treatment plants, due to the missing commercial suppliers and the relatively high investment costs.
In Switzerland, a research project on N2O emissions from wastewater treatment plants led by Eawag (Swiss Federal Institute of Aquatic Science and Technology) resulted in a versatile monitoring solution and a Spin-off company (upwater AG) offering off-gas monitoring systems and a monitoring campaign service. The technology developed has been successfully applied in 20 one-year monitoring campaigns. Here, the monitoring systems and results from a monitoring campaign are presented.
Monitoring system
The monitoring system developed by Eawag and upwater (“Notos”) consist of floating gas hoods for off-gas sample collection equipped with a flow measurement (Figure 1) and a central monitoring station for concentration measurement (Figure 3). The emissions are calculated using the following formula:
Figure 3: “Notos” monitoring system (Gruber 2021)
For concentration measurement, a NDIR gas analyzer is used for multiple sampling points. Fast response time and a low drift are important features of such a sensor. N2O concentrations in full-scale monitoring campaigns are typically between 0 and 300 ppm. However, concentrations of up to 3000 ppm can be detected during high emission phases on some plants. A fully automatized multiplexing system using 3-way valves connected with up to 14 off-gas hoods provides high spatial resolution as well as automatic calibration of the system. The central monitoring station is equipped with a liquid removal system as a pre-treatment to protect the sensor. The continuous purging of the sample lines allows short measurement intervals (<1 min).
Gas Analyser
The gas analysis is carried out using NDIR technology (INFRA.sens®) in the spectral range of 3-5µm (Figure 4). The INFRA.sens® uses the absorption bands for methane at 3.4µm, for carbon dioxide at 4.3µm and for nitrous oxide at 4.5µm. The basic photometric setup is shown in Figure 5. The radiation source is a modulating black body radiator (IR-Source), which can be modulated in the frequency range of 1-10Hz. To achieve the highest possible resolution, a 250mm long sample cell is used, which is coated with a special gold layer. The gold layer has a high reflectivity and leads to a high signal level at the detector side. The IR detector is located on the opposite side and consists of 4 elements. Interference filters are used to filter out the gas-specific spectral components for the respective detectors. The Interference filters have a very narrow bandwidth and an efficient blocking grade. This results to a very high selectivity and negligible cross interference to other gas components. A reference measurement in a spectral region without absorption due to the gas concentration ensures long-term stable measurement results.
Figure 4 : Infrared Absorption Spectrum of Methane, Carbon dioxide and Nitrous oxide
Figure 5 :Principal design of the INFRA.sens® gas sensor module
The complete signal processing takes place in an electronic evaluation unit (Base board), which is located below the optical bench as shown in Figure 6. The data transfer is managed by an RS232 Interface. CAN-Interface and MODBUS (option) are also available.
The sample cell is thermostatted at 50°C to prevent condensation inside the sample cell. Since the emitter and the detector are also heated by this thermostatisation, the temperature error of these components has also been eliminated. The entire setup is integrated in a sheet metal housing, which is insulated on the inside to block external temperature influences. The gas analyzer is specified for an ambient temperature of 5-45°C. The warm-up time is less than 45 minutes.
Figure 6: INFRA.sens® Module (CH4, CO2, N2O and O2) integrated into a sheet metal housing with temperature-controlled environment (Thermobox)
Oxygen Measurement
In addition, there is also an electrochemical (EC) oxygen sensor (galvanic fuel cell) in this setup to measure the oxygen concentration in the gas mixture. The O2.sensD has a range of 0-100Vol.% O2 and is very selective for Oxygen, even in the presence of other gases at high concentrations. Compared to physical gas sensors the lifetime of electrochemical gas sensors is limited due to the chemical reactions within the sensor. The lifetime is measured in Vol.%·h. Typical sensor lifetime is >500.000Vol.%·h. In the presence of 10-20Vol.% oxygen the calculated lifetime is approx. 3-6 years. The O2.sensD is able to communicate with the INFRA.sens electronics (Base board) via I2C interface. Compared to a standard millivolt data transfer the I2C interface is very rugged and less sensitive against electromagnetic interference (EMI).
Figure 7. Electrochemical Oxygen gas sensor (O2.sensD) integrated into a standard INFRA.sens® module.
General features
Table 1: Gas analysis specifications
Monitoring campaign
The strong seasonal and diurnal emission variation can be seen in a one-year monitoring campaign at a Swiss wastewater treatment plant (Figure 8). The short-term dynamics are strongly influenced by rain events which are indicated by temperature drops. Typically, rain events substantially decrease N2O emissions due to dilution of the wastewater. The emissions reach their maximum during the strong wastewater temperature increase between spring and summer. The maximum concentration at this plant was 350 ppm. The emission peak phase can probably be linked to a change in the composition of the microbial community with strong impacts on the accumulation of nitrogen compounds leading to N2O formation. Mitigation strategies at this plant mainly involve reduction of air flow in the biological treatment and optimization of denitrification. Thanks to the monitoring campaign substantial energy savings could be achieved by monitoring oxygen transfer and adapting the aeration system and strategy accordingly.
Figure 8: N2O emissions and temperature during a one-year monitoring campaign on a Swiss wastewater treatment plant (updater 2024)
Conclusion
N2O is an important source of greenhouse gases from wastewater treatment. Due to the substantial spatial and temporal variation of the emissions, long-term on-line monitoring approaches with a high spatial resolution is required for emission quantification and mitigation strategies. The “Notos” off-gas monitoring system has been demonstrated to be applicable in a wastewater treatment environment over long-term. The system is based on an accurate multi-channel NDIR gas analyser (INFRA.sens®) integrated into a fully automated monitoring system. The stability and accuracy of the NDIR technology used was impressively demonstrated in various series of measurements. Continuous use over a maintenance period of several months is therefore possible without any problems. In the future, wastewater treatment plants are expected to monitor N2O emissions to reduce the carbon footprint and foster the full potential of off-gas monitoring systems for energy savings.
References
Wiegleb, G.: Gas Measurement Technology in Theory and Practice, Springer Verlag Wiesbaden 2023 (https://doi.org/10.1007/978-3-658-37232-3)
Gruber, W., Long-term N2O emission monitoring in biological wastewater treatment: methods, applications and relevance, in Institute for Environmental Engineering. 2021, ETH Zurich: Zurich. p. 292. (https://doi.org/10.3929/ethz-b-000537321)
Gruber, W., Magyar, P. M., Mitrovic, I., Zeyer, K., Vogel, M., von Känel, L., … Mohn, J. (2022). Tracing N2O formation in full-scale wastewater treatment with natural abundance isotopes indicates control by organic substrate and process settings. Water Research X, 15, 100130 (11 pp.). https://doi.org/10.1016/j.wroa.2022.100130
Free to read
Articles are free to download. Please login to read this article or create an account.


Events
Feb 16 2025 Kampala, Uganda
Feb 26 2025 Chennai, India
Feb 26 2025 Tulsa, OK, USA
WATERTECH CHINA (GUANGDONG) 2025
Mar 05 2025 Guangdong, China
Mar 11 2025 Amsterdam, Netherlands